Genomic Epidemiology Visualization Typology (GEViT)
Lead: Tamara Munzner
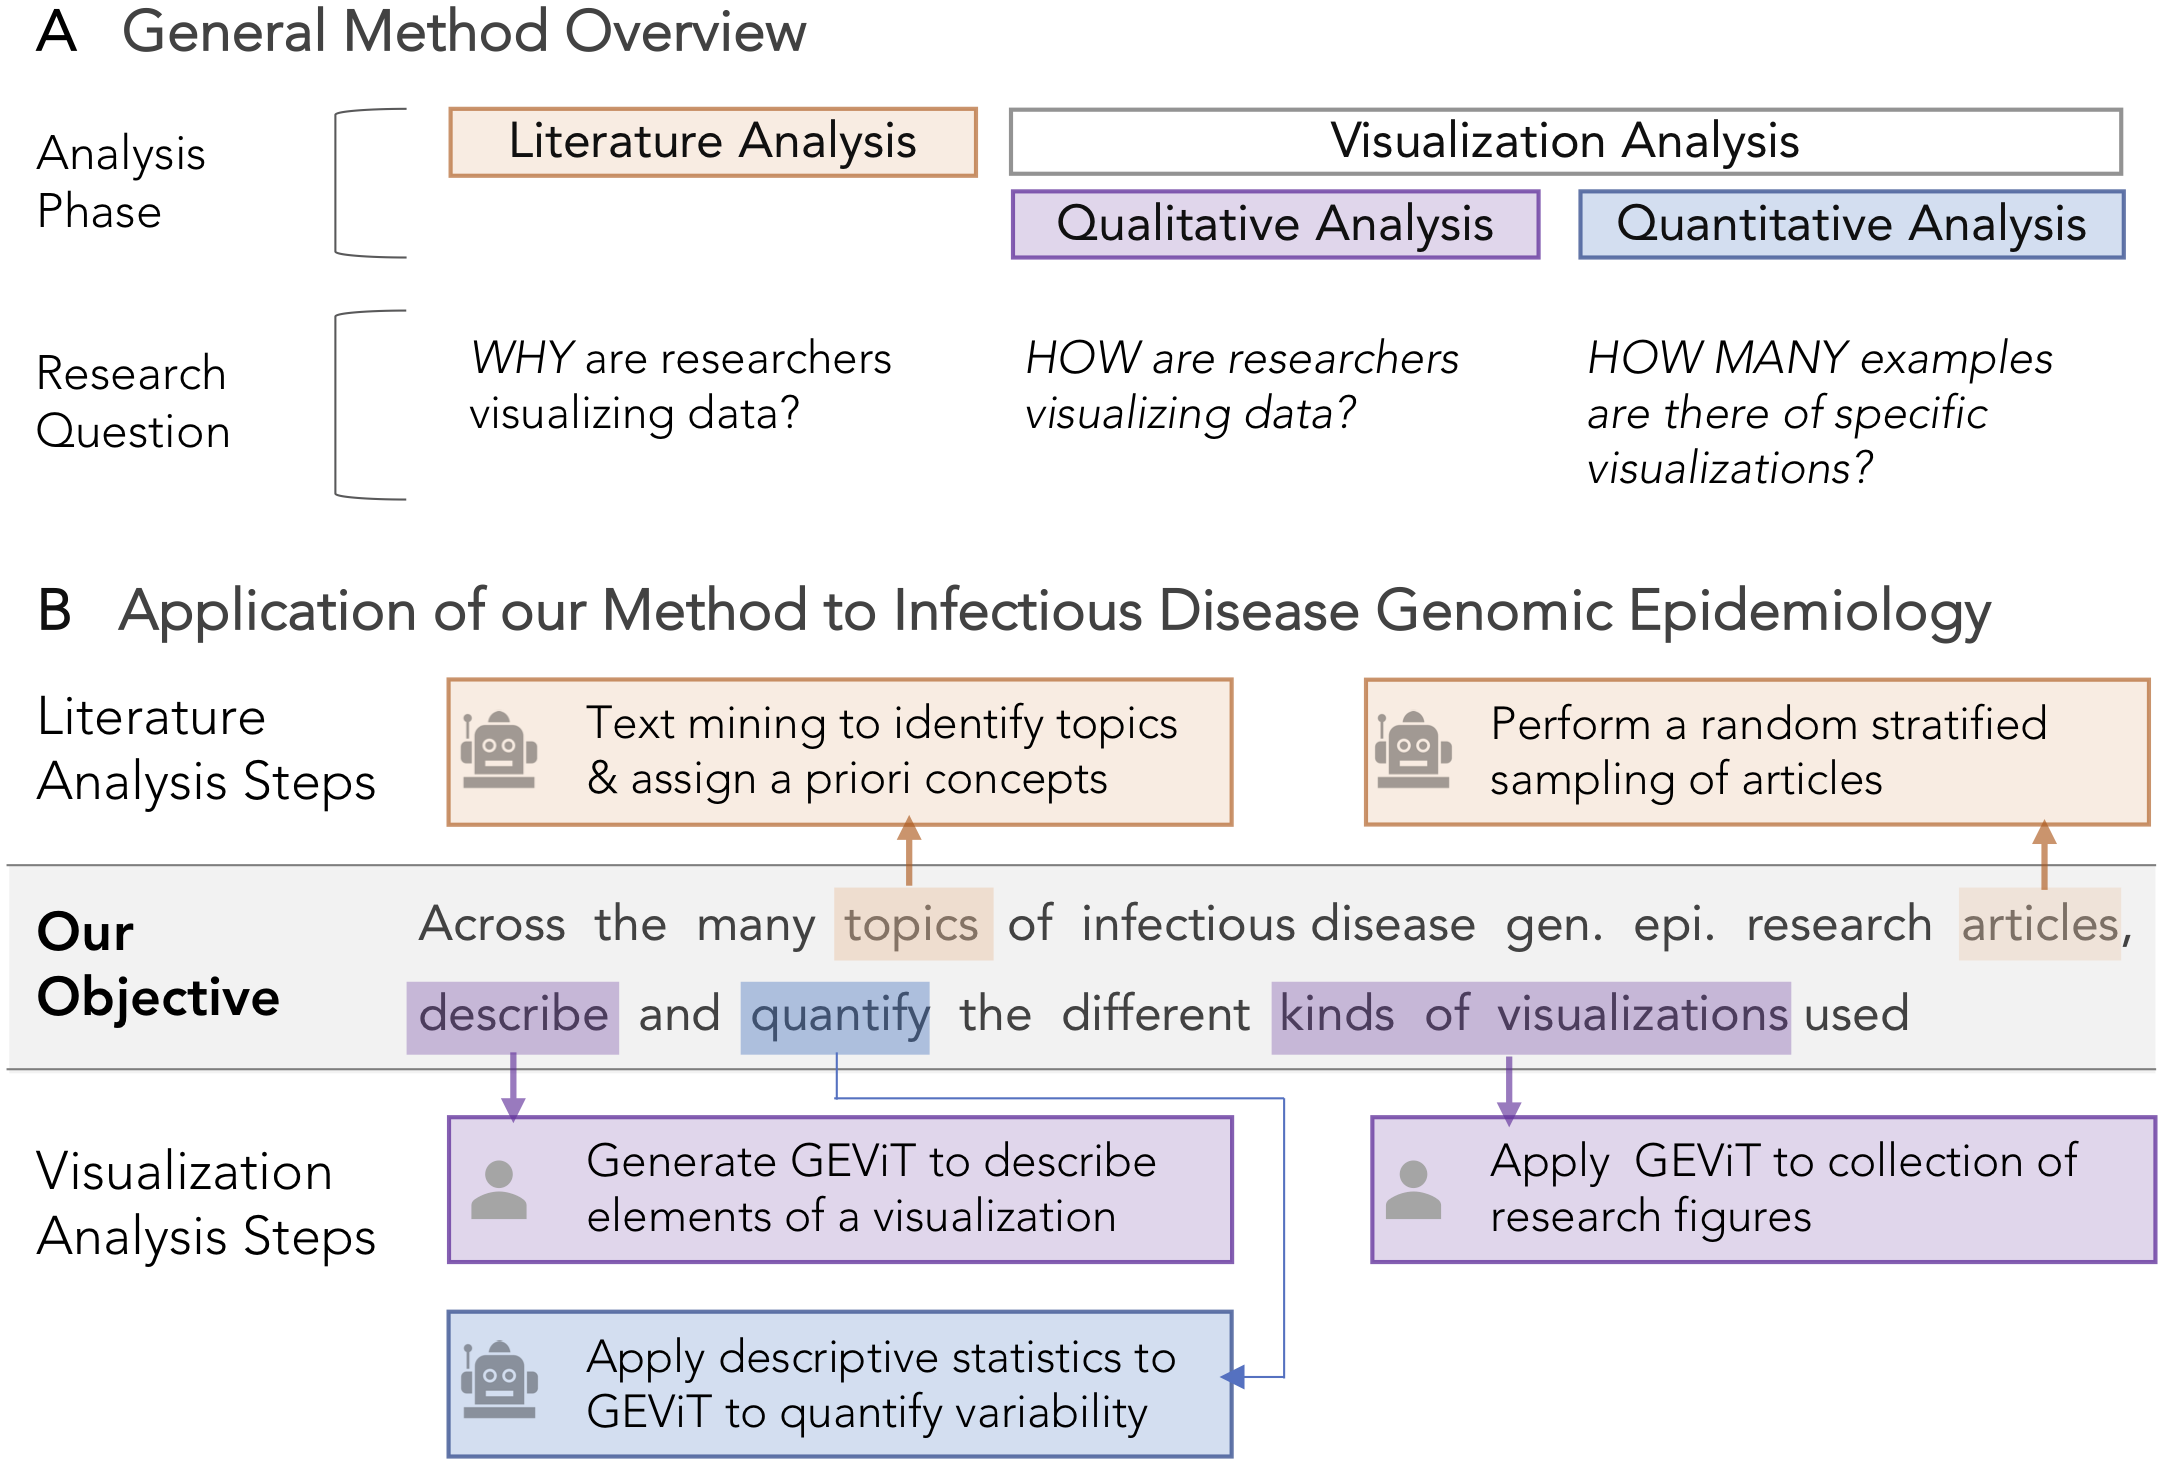
The GEViT project is a collaboration between PhD student Anamaria Crisan, DFP faculty member (CS) Tamara Munzner, and Jennifer Gardy (faculty, UBC School of Population and Public Health & Senior Scientist, BC Centre for Disease Control), in the health care domain. We have developed a method that systematically surveys data visualizations using the analysis of both text and images. Our method supports the construction of a visualization design space that is explorable along two axes: why the visualization was created and how it was constructed. We applied our method to a corpus of scientific research articles from infectious disease genomic epidemiology and derived a Genomic Epidemiology Visualization Typology (GEViT) that describes how visualizations were created from a series of chart types, combinations, and enhancements. We have also implemented an online gallery that allows others to explore our resulting design space of visualizations. This paper is now published.
A systematic method for surveying data visualizations and a resulting genomic epidemiology visualization typology: GEViT
Anamaria Crisan Jennifer L Gardy Tamara Munzner
Bioinformatics, bty832, https://doi.org/10.1093/bioinformatics/bty832